


When evaluating an MSP for acquisition, buyers look beyond annual revenue and reported profit. They examine how quickly the business collects payments, how much of its accounts receivable is overdue, how efficiently billing operates, and whether its earnings can be verified.
Six specific financial metrics deserve particular attention: days sales outstanding (DSO), accounts receivable aging, bad debt and write-off rate, cost per invoice processed, adjusted EBITDA, and revenue recognition consistency.
Together, these facts give buyers the full picture of the health and growth potential of your MSP.
This article explains what each metric measures, how to calculate it, and what buyers look for during financial due diligence. For guidance on improving these numbers before a sale, see How to prepare your finances before selling your MSP.
1. DSO (days sales outstanding): What it is and why buyers check it first
Days sales outstanding (DSO) measures the average number of days it takes a business to collect payment after making a credit sale. It is one of the clearest indicators of how efficiently an MSP converts invoiced revenue into cash.
The standard DSO formula is:
DSO = (Accounts Receivable ÷ Total Credit Sales) × Number of Days
For a business generating $1 million in annual credit sales, every additional day of DSO represents approximately $2,700 in cash tied up in receivables, assuming relatively consistent sales throughout the year.
Research cited by FlexPoint from PYMNTS also indicates that businesses using automated accounts receivable processes report payment cycles roughly twice as fast as businesses relying primarily on manual workflows.
For an MSP preparing to sell, the difference between a 30-day and a 60-day payment cycle can be significant. Even if both businesses report identical revenue, one has substantially more cash tied up in unpaid invoices.
How to calculate DSO

Suppose an MSP has the following figures for a 90-day period:
- Accounts receivable: $150,000
- Total credit sales: $450,000
- Number of days: 90
Using the DSO formula: ($150,000 ÷ $450,000) × 90 = 30 days
The MSP's DSO is 30 days, meaning its outstanding receivables represent approximately 30 days of credit sales.
For the most useful comparison, use average accounts receivable over the period rather than relying exclusively on an unusual period-end balance. Apply the calculation consistently across reporting periods.
What buyers look for in your DSO
Buyers typically want to see more than a single DSO figure. They may review monthly trends, compare collection timing with contractual payment terms, and investigate sudden increases.
An MSP with net-30 payment terms and a DSO consistently near 30 days tells a different story from one with the same terms but a DSO approaching 60 days.
The second MSP may have invoicing delays, disputed charges, inconsistent payment follow-up, or customers experiencing financial difficulty.
Buyers will want to understand which explanation applies.
Payment method mix can also help explain DSO performance.
MSPs with AutoPay adoption rates of 70% or higher collect payments an average of 15–20 days faster than those relying primarily on manual payment processes.
That makes AutoPay adoption a useful supporting metric alongside DSO. It helps explain both how quickly an MSP gets paid and also how dependent its payment cycle is on customers remembering to initiate each transaction.
If you don't know your current DSO, start with our DSO Calculator.
2. AR aging distribution and concentration risk
An accounts receivable aging report, sometimes called an AR aging report, organizes unpaid customer invoices according to how long they have been outstanding.
Unlike DSO, which summarizes collection timing into a single number, an AR aging report shows where unpaid balances are accumulating.
A standard accounts receivable aging report uses five categories:
These buckets are typically based on days past the payment due date, although report settings can vary between accounting systems.
For buyers, the distribution matters as much as the total balance.
An MSP with $200,000 in accounts receivable, most of it current, presents a different risk profile from one with $200,000 outstanding and a large share more than 90 days overdue.
Two AR warning thresholds buyers may flag
Our AR & Billing Pre-Diligence Checklist for MSP Acquirers identifies two specific warning thresholds:
More than 15% of total AR in the 90+ day bucket.
This indicates that a meaningful share of outstanding payments has remained unresolved well beyond normal payment terms. Buyers may investigate the age of those balances, the likelihood of recovery, and whether reserves or write-offs are appropriate.
The five largest customers accounting for more than 40% of total AR.
This indicates concentration in outstanding receivables. If one or two large customers delay payment, the MSP's cash position may be disproportionately affected.
These are diligence warning thresholds, not universal acquisition rules or automatic reasons to reject a business.
It's also important to distinguish AR concentration from revenue concentration. A customer may account for a large share of outstanding AR because of a temporary billing issue without representing the same share of annual revenue.
Buyers may examine both measures, but they answer different questions.
What a buyer will investigate
An aging report can raise questions that a balance sheet alone cannot answer.
- Why has one account remained unpaid for 120 days?
- Are the invoices disputed?
- Has the customer acknowledged the balance?
- Are older receivables regularly written off, or do they remain on the books indefinitely?
A buyer may request historical aging reports, customer-level balances, dispute records, and subsequent payment activity to determine how much of the reported AR is likely to become cash.
A clean aging report isn't necessarily one with no overdue invoices. It's one where balances are accurate, exceptions are understood, and the business can demonstrate a consistent process for resolving them.
3. Bad debt and write-off rate
Bad debt is money owed to a business that is unlikely to be collected. A write-off occurs when an uncollectible receivable is removed from the accounts receivable balance under the company's accounting policies.
For an MSP, bad debt can result from customer insolvency, unresolved invoice disputes, or balances that remain unpaid despite repeated follow-up.
One useful metric is the write-off rate:
Write-off Rate = (Receivables Written Off ÷ Credit Sales) × 100
For example, suppose an MSP records $15,000 in customer receivable write-offs against $1.5 million in annual credit sales.
Its write-off rate would be:
($15,000 ÷ $1,500,000) × 100 = 1%
That percentage becomes more informative when compared across several years.
Why buyers examine the trend
An isolated write-off may have a straightforward explanation. A long-standing customer closes unexpectedly, or a disputed balance becomes uneconomical to pursue.
But a rising write-off rate can suggest something more persistent.
Buyers may interpret it as a sign of weak billing controls, inadequate follow-up, recurring invoice disputes, or inconsistent customer credit practices.
In other words, buyers may read a rising write-off rate as a process problem, not simply a client problem.
They may also compare recorded write-offs against the aging report. If an MSP reports almost no bad debt but has a large volume of receivables more than 90 days overdue, that discrepancy deserves an explanation.
The question isn't only how much revenue has been lost. It's whether the financial statements accurately reflect the amount the business can reasonably expect to collect.
4. Cost per invoice processed
An MSP can collect nearly every invoice and still spend too much money doing it.
Cost per invoice processed measures the administrative expense associated with preparing, issuing, managing, and reconciling an invoice.
Depending on how the metric is defined, those costs may include staff time spent generating invoices, correcting errors, answering billing questions, following up on overdue payments, and matching deposits to open balances.
The basic formula is:
Cost per Invoice = Total Invoice-Processing Costs ÷ Number of Invoices Processed
Consider an MSP processing 200 invoices each month at an average administrative cost of $12 per invoice.
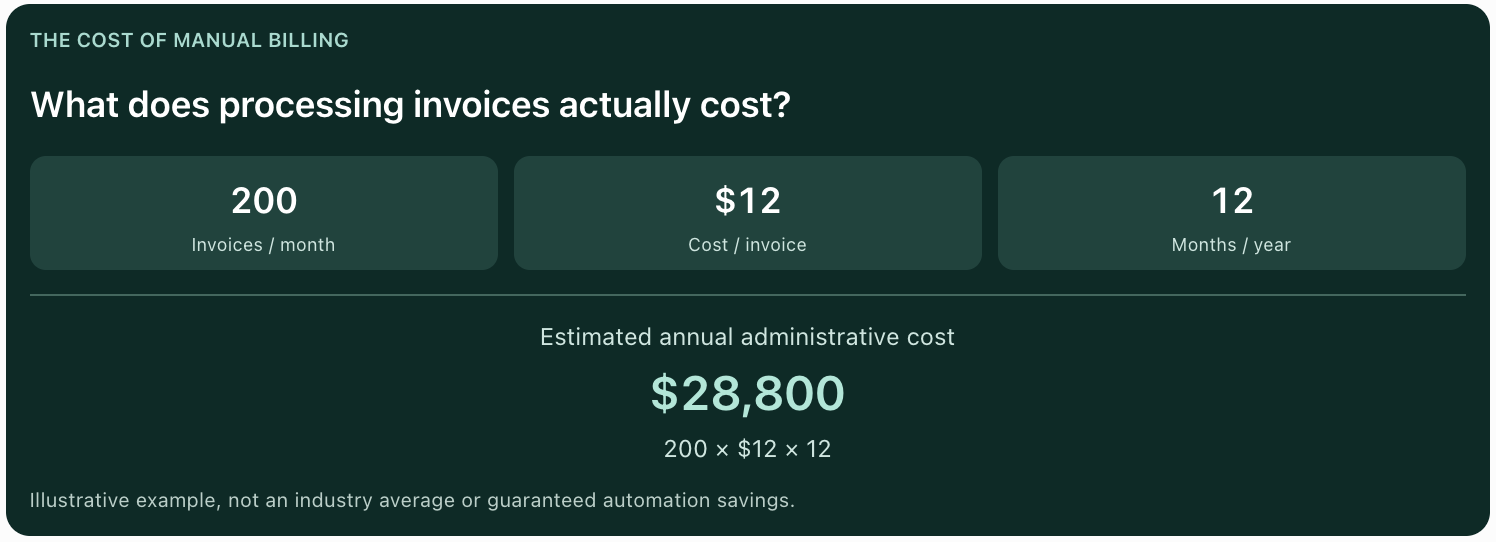
The math is straightforward:
- 200 invoices per month
- $12 average processing cost per invoice
- $2,400 in monthly processing costs
- $28,800 in annual processing costs
That's $28,800 a year spent on the mechanics of getting paid, before accounting for other costs that may fall outside the estimate, such as financing costs associated with slow payments.
This is an illustrative calculation, not an industry-wide average.
Why buyers care about billing costs
Billing is a recurring operational function. As an MSP grows, its invoice volume may increase even if the underlying services remain largely the same.
If each additional invoice requires substantial manual effort, administrative costs can grow alongside revenue.
Buyers want to understand whether the existing billing operation can support a larger business without proportionally increasing headcount or overhead.
That makes cost per invoice a useful indicator of operating efficiency.
However, the metric should be calculated consistently. An MSP that includes payment processing fees and software subscriptions in its invoice cost cannot be compared directly with one that counts staff time alone.
The underlying assumptions matter.
Automation can reduce the manual work involved in invoice delivery, payment follow-up, and reconciliation. For example, FlexPoint's AR Agents can handle recurring AR follow-up work and surface situations requiring human attention.
But reduced workload does not automatically mean reduced expense.
If automation saves staff time without changing payroll or other operating costs, the immediate benefit may be additional capacity rather than a direct increase in profit.
For a buyer, both outcomes can be valuable, but they should be presented accurately.
5. EBITDA quality and adjusted EBITDA
EBITDA stands for earnings before interest, taxes, depreciation, and amortization. It is commonly used as a starting point for valuing MSPs because it helps buyers compare operating earnings across businesses with different financing and accounting structures.
But reported EBITDA isn't always the number a buyer ultimately uses.
During financial due diligence, buyers may calculate adjusted EBITDA to account for certain non-recurring expenses, unusual income, owner-specific costs, and expenses necessary to operate the business under new ownership.
A useful framework is:
Adjusted EBITDA = Reported EBITDA + Supported Add-backs − Non-recurring Income ± Normalizations − Replacement Costs
The formula is a framework rather than a universal accounting standard. Adjustments depend on the transaction, the business, and the evidence supporting each item.
For example, an owner might argue that a one-time legal expense should be added back because it won't recur after the sale.
That adjustment may be reasonable if the expense was genuinely unusual and properly documented.
But if the owner also performs duties that would require hiring a replacement manager, the expected cost of that replacement needs to be considered.
Buyers are evaluating the earnings the business can sustain after the current owner leaves, not simply the highest EBITDA figure a seller can produce.
Why adjusted EBITDA matters to MSP valuation
At GTIA ChannelCon 2026, Craig Fulton of Evergreen cited average North American MSP valuations of approximately 6–8× EBITDA, with 70–75% recurring revenue representing a strong revenue mix.
These figures are useful reference points, not guaranteed valuation multiples or universal benchmarks for every MSP.
Actual multiples vary based on business size, earnings quality, growth, customer concentration, contracts, and buyer expectations.
To see how the arithmetic works, consider an MSP with $500,000 in adjusted EBITDA.
At an illustrative 6× multiple, its enterprise value would be $3 million.
At 8×, it would be $4 million.
That $1 million difference demonstrates why the quality and perceived durability of earnings matter alongside the reported EBITDA amount.
It also explains why recurring revenue deserves attention during financial diligence. Buyers may have greater confidence in earnings supported by long-term, verifiable managed services agreements than in earnings dependent on unpredictable project work.
What makes an EBITDA adjustment credible?
Buyers may ask for invoices, payroll records, general ledger detail, and other documentation supporting proposed add-backs.
They will also consider whether the expenses being removed are genuinely non-recurring or simply normal costs of operating the business.
For a more detailed breakdown of adjusted EBITDA, add-backs, and the records needed to support them, see How to prepare your finances before selling your MSP.
6. Revenue recognition consistency
Revenue recognition determines when revenue is recorded in the financial statements.
Under cash-basis accounting, revenue is generally recorded when payment is received; under accrual accounting, revenue is recognized when earned, subject to the applicable accounting rules.
Buyers may flag inconsistencies between cash-basis reporting, accrual financial statements, billing records, and the timing of service delivery, particularly when an MSP has never undergone a formal audit or quality of earnings review.
An MSP should be able to reconcile reported revenue to its customer agreements, invoices, accounting records, and applicable recognition policies.
Which financial metrics should an MSP review before selling?
The six metrics above give buyers different views of the same underlying question: How reliably does this MSP generate earnings and convert those earnings into cash?
Before entering a sale process, review:
- Days sales outstanding (DSO): How many days does it take to collect payment, and is that period increasing or decreasing?
- AR aging and concentration: How much of your outstanding AR is overdue, and how much depends on a small number of customers?
- Bad debt and write-off rate: What portion of credit sales is ultimately written off, and what does the trend reveal about billing discipline?
- Cost per invoice processed: How much administrative expense does it take to issue, manage, and reconcile each invoice?
- Adjusted EBITDA: How much operating earnings can you substantiate after appropriate adjustments and replacement costs?
- Revenue recognition consistency: Do your accounting records accurately and consistently reflect when revenue is earned?
You don't need perfect numbers in every category to sell an MSP. But you should understand your financial performance well enough to explain what the numbers mean, why they've changed, and what a buyer can reasonably expect after closing.
Start with the numbers you can verify
If you're beginning to assess your MSP's financial readiness, start with two practical steps.
Calculate your DSO. Use FlexPoint's DSO Calculator to understand how much working capital may be tied up in your payment cycle and what an improvement could mean for cash availability.
Review your financial records before diligence begins. Download the AR & Billing Pre-Diligence Checklist for MSP Acquirers to understand the AR reports, billing records, concentration risks, and warning signs that can become important during acquisition review.
The earlier you understand these numbers, the more time you have to resolve discrepancies, document unusual items, and give prospective buyers a financial picture they can trust.