


%2520(1)%2520(1).jpeg)
Over the last few years, MSPs have experienced consistent industry growth, but many still struggle with profitability. According to industry benchmarking data, while top-tier MSPs are achieving record adjusted EBITDA rates, a significant portion of the market operates with razor-thin margins or even losses. In fact, industry data shows nearly a third of MSPs lose money or barely break even on an EBITDA basis, with average margins that pale in comparison to other professional services like legal or financial industries.
So what separates the MSPs that thrive financially from those that don’t? The answer lies in understanding service-line profitability: the ability to break down your revenue and costs by the type of service you deliver and then take action based on what the data reveals.
In this guide, we’ll walk through the essential framework MSP leaders need to understand service-line profitability, uncover hidden financial leaks, and take practical steps to improve profitability across their businesses.
Why Service-Line Profitability Matters for MSPs
At a high level, profitability isn’t just about total revenue. Real, sustainable profit comes from understanding which parts of your business contribute the most (and the least) to your bottom line.
Industry benchmarking from the Service Leadership Index shows best-in-class MSPs consistently achieving 19%+ adjusted EBITDA, even despite economic headwinds. But many MSPs land at or below the 8–12% profitability range, or worse, operate at a loss.
To close that gap, you need data-driven insight into exactly where your revenue and costs are coming from.
The Four Core Revenue Categories Every MSP Should Track
According to Service Leadership’s framework, MSP financial performance breaks down into ten categories overall, but four are most critical for profitability analysis:
- Product Sales
Revenue from hardware, software, or third-party products you resell. Traditionally, profit margins here are lower than service lines but important for overall revenue diversification. - Technical Services (Break/Fix)
This is reactive, time-and-materials work. The more hours you bill, the more revenue you generate, but also the more your costs rise. There’s a limited opportunity here for predictable recurring profit unless tightly managed. - Professional Services (Project Work)
These engagements include Statements of Work (SOWs) and planned projects. They require project management rigor to ensure time and cost stay aligned with agreed-upon fees. - Managed Services (Recurring)
Unlike break/fix, managed services are usually delivered under service level agreements (SLAs). Profitability here depends on leveraging tools and automation to reduce per-unit cost, meaning the less time you spend delivering a service, the more profitable it becomes over time.
Step-by-Step: How to Analyze Service-Line Profitability
The fastest way to improve MSP profitability is to stop treating the business as one giant revenue bucket. Each service has a different economic structure, associated risks, agreements, and costs. And because of that, they should be measured accordingly.
Separate Revenue and Cost by Service Line
Most MSPs think they know which parts of their business are profitable, until they break out revenue and costs by service line and discover that their assumptions were wrong. Service Leadership’s research consistently shows that top-performing MSPs track profitability at the service-line level, not just at the business level, because each service type has a fundamentally different cost structure, utilization profile, and margin pattern.
The first step is to disaggregate both your revenue and your costs into the correct buckets. At a minimum, that means separating:
- Product Sales
- Technical Services
- Professional Services
- Managed Services
For our purposes, we’ll focus on the last three since they are the most confusing. As mentioned briefly already, each of these services behaves differently. For example, break/fix revenue scales up with labor hours (more hours = more revenue), while managed services are intentionally non-labor-scaling (fewer hours = higher margin). You simply cannot manage them as a single financial bucket.
To get accurate visibility, you must split out all revenue and all associated delivery costs, including:
- Hard costs (RMM, backup, AV, PSA, cloud compute, licensing)
- Direct labor costs (technicians, engineers, time spent delivering)
- Burdened labor costs (benefits, taxes, PTO, training, internal meetings)
- Allocated overhead (management time, tools used across multiple services)
- Any subcontractor costs
- Project-specific costs (hardware, software, outside labor)
Most MSPs underestimate their true labor cost by 20–40%. Once burden, PTO, meetings, and non-billable time are factored in, a technician with a $90,000 salary often carries a fully burdened cost of around $130,000–$145,000 annually. Divide that into usable hours and your real cost per hour becomes the foundation of your margin calculations.
This is also where your PSA becomes irreplaceable. By tagging time entries, agreements, tickets, and projects correctly, you can map:
- Exactly how much labor each service line consumes
- Which clients over-utilize your team
- Which agreements are underwater
- Which tools are directly tied to which revenue streams
When revenue and cost are separated clearly for each service, patterns emerge quickly. Many MSPs discover that they are unintentionally subsidizing one service line with another, particularly when project labor overruns eat into managed services margin, or when unmanaged product sales create razor-thin margins that distort overall profitability.
Once this clarity exists, decisions become far less emotional. You're no longer asking, “Should we bill more hours?” Instead, you can clearly identify, “Our managed services line is underperforming at a 38% margin instead of our 55% target. Why?” Specific reality-based questions are the only actionable questions that can be brought to a meeting and are the beginning of operational truth.
Run a Service-Specific P&L
Once each revenue stream and cost bucket is properly assigned, you can build a Profit & Loss statement for each service line, which is the gold standard recommended by nearly every financial consultant working in the MSP space.
A service-specific P&L lets you calculate:
- Gross margin per service line (revenue – direct costs)
- Contribution margin (gross margin minus allocated overhead)
- True COGS (labor + tooling + client-specific variable cost)
- Profitability trends over time by service type
- The cost-to-deliver per agreement, per user, or per endpoint
This level of granularity matters because each service line has a different margin profile. For example:
- Break/fix/tech services: Typically 30–40% gross margin when priced properly, but easily slip under 20% if labor efficiency drops.
Professional services: Highly variable but often targeted at 45–60% margin; the biggest risk factors are scope creep, poor pre-sales scoping, and low project velocity.
Managed services: Healthy, mature MSPs consistently achieve 50–60% gross margin due to automation, predictable ticketing, and tool-driven delivery, but only when tooling and labor are mapped correctly.
A service-specific P&L exposes hidden margin erosion that is nearly impossible to see otherwise. To give some specific examples: you may discover that your “profitable” MSP is actually running at 8% total margin only because managed services are propping up consistent losses in professional services; you may find that SMB clients on legacy agreements are consuming 3x more labor per endpoint than mid-market clients; you may see that product resale is generating large top-line revenue but no bottom-line contribution; you may realize cloud backup costs have silently increased 20–30% year-over-year because client usage grew but pricing didn’t.
Once you can see the margin per service line, you can align pricing, delivery, staffing, and automation strategy to improve that margin. Without this information, you are operating on hope and instinct.
If any service line falls below your profitability target, you can take targeted action on that specific area, rather than guessing, raising prices across the board, or fixing one part of the business while unintentionally hurting another. This approach lets you improve margins where they’re actually weak while protecting the services that are already performing well.
And with service-specific P&Ls in place, you can drill even deeper into:
- Profitability per client
- Profitability per technician
- Profitability per agreement type
- Profitability per tool or stack component
This transforms financial management from reactive to proactive. Instead of discovering at year-end that profits are low, you can course-correct each quarter (or even each month) based on what the data tells you.
An Extra Step: Customer-Level MSP Profitability
Once you’ve mapped profitability by service line, the next meaningful layer is understanding profitability at the customer level. This was touched on briefly in the previous sections, but it’s worth mentioning more thoroughly again, because it’s easy to see “any client” as a good client. That is not always the case.
Not all clients contribute to your business equally, and “big revenue” doesn’t always mean “big profit.” By analyzing agreement performance per customer, you can identify which clients consistently consume more support time than they pay for, which service plans erode margin, and whether certain contract structures or industries are inherently less profitable for your team. It’s an underutilized MSP profitability strategy to revisit (or even dissolve) contracts that are eating into your margin.
How to Improve MSP Profitability
Improving MSP profitability isn’t about guessing, cutting randomly, or simply raising prices across the board. It’s about getting visibility into the financial reality of your services, aligning pricing with delivery economics, and ensuring your business systems support predictable cash flow and margin. Here’s how MSPs can take practical, meaningful steps toward stronger financial health.
1. Track Key Financial KPIs
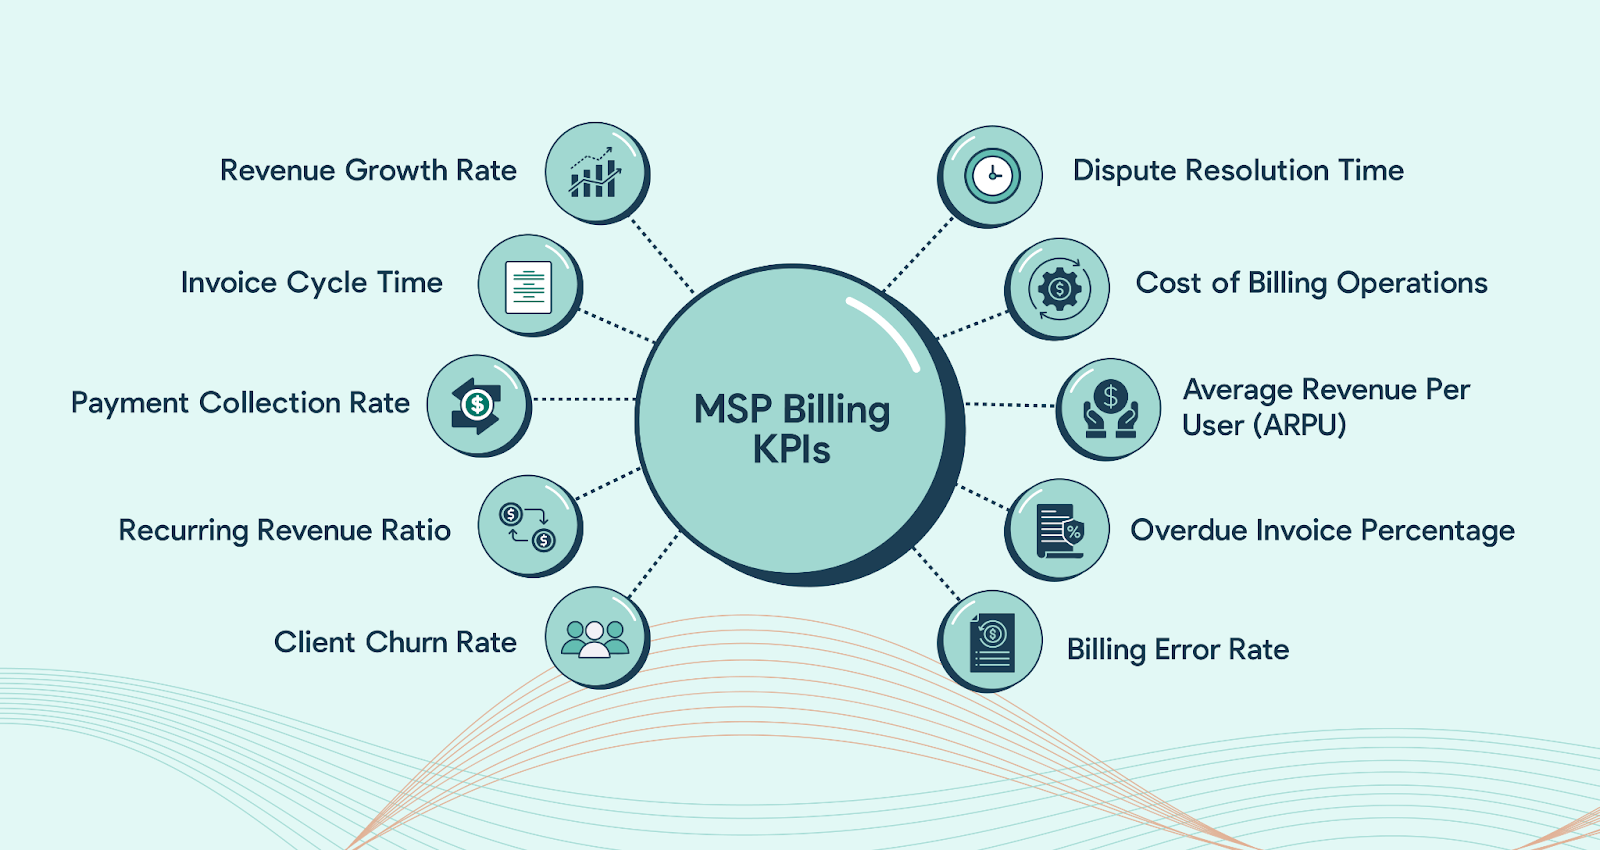
If you want better profitability, you need to measure the right things. Many MSPs track top-line revenue or ticket counts but overlook the metrics that actually reveal financial performance. Instead, the focus should be on financial KPIs like gross margin by service line, percentage of recurring revenue, contribution margin per client, and overall EBITDA or operational profitability. These numbers tell you whether your services are priced correctly, whether your delivery model is sustainable, and whether your margins are improving or eroding over time.
When you consistently monitor these KPIs, financial conversations become less emotional and more data-driven, which allows you to make confident decisions about pricing, staffing, tooling, and investment.
Another under-explored KPI is DSO, which will give you the clearest understanding of your billing health.
2. Price Managed Services for Automation Efficiency
Profit in managed services comes from designing a delivery model where automation, tooling, and strong processes reduce labor intensity over time. That means pricing must not only account for the cost of tools and licenses, but also for the labor required to support the agreement, the service levels promised, and the real-world behavior of the client environment. When pricing is aligned to automation efficiency, scaling doesn’t destroy margin. Instead, you can grow while maintaining or improving profitability rather than silently absorbing cost as environments expand.
For break/fix, technical services, or product sales something similar is true. What was profitable two years ago may not be profitable now, even if your revenue looks strong on the surface. MSPs should (at least) yearly review whether pricing still reflects the true cost of delivery, margin targets, market positioning, and the level of expertise being provided. Sometimes the fix is adjusting rates. Other times it’s restructuring packages, removing unprofitable inclusions, or moving more clients into standardized agreement tiers. The goal with this point isn’t simply to charge more to improve profitability; it’s to ensure all your pricing aligns with the real financial and operational reality of your business.
3. Use Benchmarking Tools
It’s difficult to know whether your MSP is performing well financially without something objective to measure against. That’s where benchmarking becomes invaluable. Industry benchmarking programs like the Service Leadership Index help MSPs compare margins, service performance, pricing, and operational efficiency against best-in-class peers.
Benchmarking removes guesswork and gut feel by showing whether your profitability challenges are normal, structural, or execution-related. It also gives leadership realistic performance targets instead of arbitrary financial goals. When you know what “healthy” actually looks like, it becomes much easier to create an improvement plan.
4. Align Financial Tools, Accounting, and Operations
One of the biggest reasons MSPs struggle with profitability is operational disconnect. None of the systems MSPs rely on were truly built to operate together, so MSPs end up running a business on spreadsheets, exports, manual checks, and crossed fingers. When financial and operational data live in one ecosystem, billing becomes timely and accurate, finance teams stop firefighting, and leadership finally gets a clear understanding of where money is earned, where it’s lost, and how to fix the gaps before they become real financial problems.
Profitability improves dramatically when financial operations are synchronized instead of taped together.
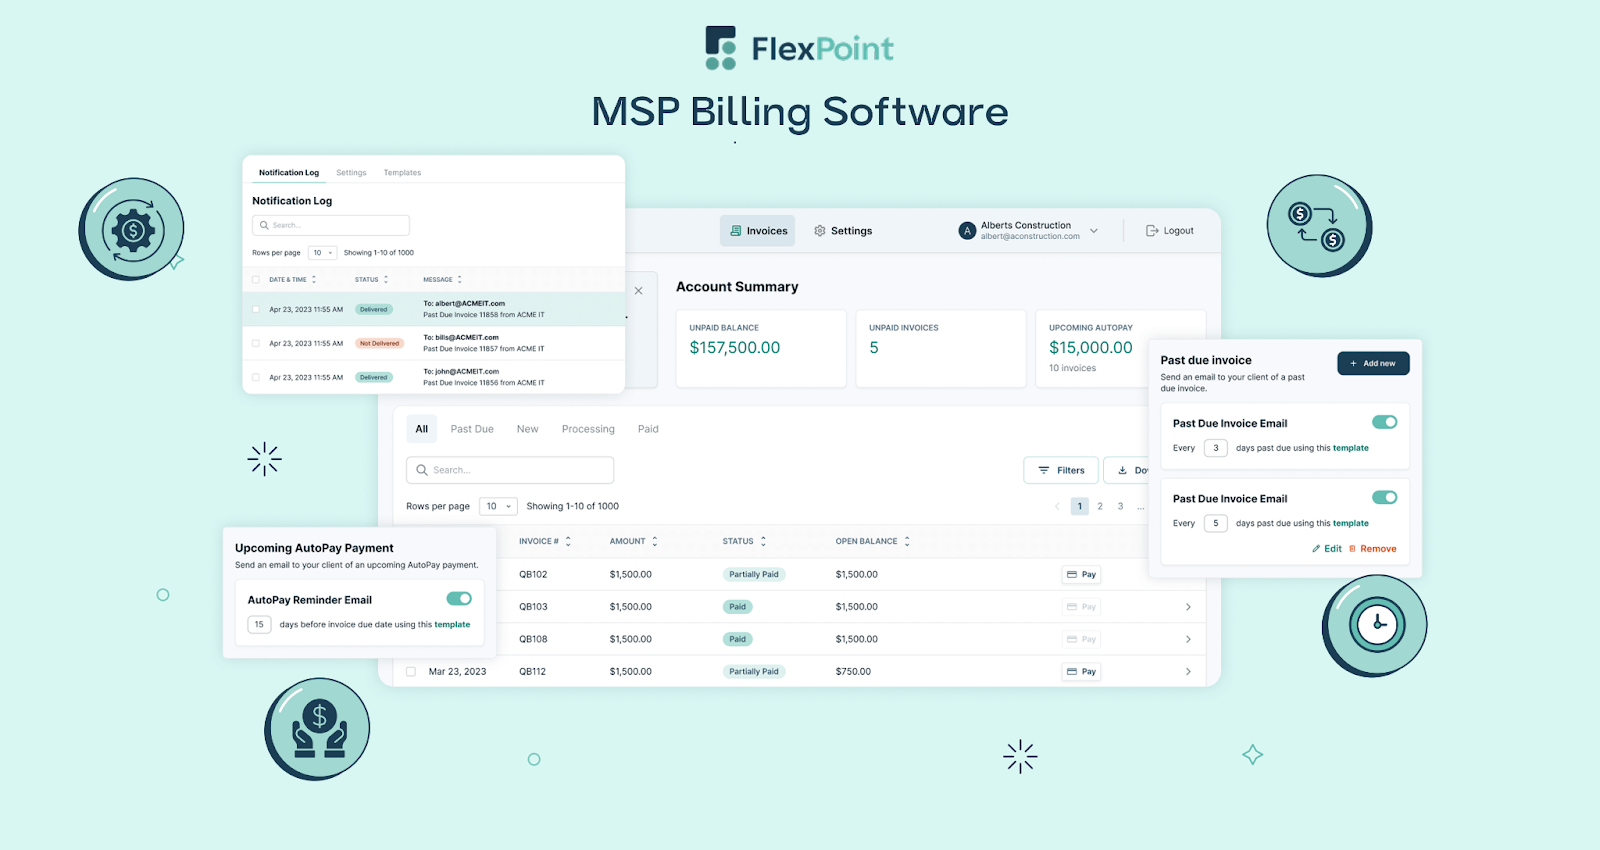
FlexPoint is built specifically to fix this financial disconnect MSPs struggle with. Instead of forcing your team to reconcile PSA data, vendor usage, client changes, invoices, and accounting records manually, FlexPoint centralizes financial operations into one platform designed for how MSPs actually run. It pulls usage and agreement data directly from your PSA, syncs with your accounting system, and ensures billing is accurate, timely, and fully aligned to what was delivered.
Get Ahead of Profitability Challenges in Your MSP
Understanding service-line profitability isn’t a finance exercise you do once and forget about; it’s an ongoing discipline that separates resilient MSPs from those constantly struggling with cash flow and uncertainty. Because the MSPs that win overall aren’t guessing. They’re measuring, benchmarking, and adjusting based on real operational and financial data. They know exactly which services create healthy profit, which ones need refinement, and which clients, contracts, or offerings quietly drain margin over time.
If your team is still making financial decisions based on gut feel or a single number, now is the time to change that. Start by getting visibility. Separate revenue and costs per service line, build service-specific P&Ls, and then benchmark your performance against industry standards. Then make sure to align your billing, PSA, and accounting systems so your financial data actually reflects reality. When you do that, profitability stops being mysterious; it becomes real.
The MSP market isn’t slowing down, but the ones who scale successfully will be those who treat profitability like an operational discipline, not a hope. With the right financial framework, the right tooling, and the right visibility into margins, you can protect your business, invest confidently, and build a more predictable, more profitable MSP in the years ahead.
If you want support understanding your margins, tightening billing workflows, or getting financial clarity as you grow, our Common Financial Challenges for MSPs webinar was designed to help MSPs do exactly that.
FAQs
What is service-line profitability for MSPs?
Service-line profitability breaks down revenue and costs by service type to show which parts of your business are truly profitable.
Why is managed services profit different from tech services profit?
Managed services rely on automation and recurring revenue, so fewer billable hours can mean higher margins compared to time-intensive break/fix services.
How do MSPs benchmark their financial performance?
MSPs use industry benchmarking platforms like the Service Leadership Index to compare KPIs against best-in-class peers.
What are key financial KPIs for MSP profitability?
Important KPIs include recurring revenue rate, gross margin per service line, client contribution margin, and EBITDA.
Can product sales hurt my MSP’s overall profitability?
Product sales can contribute revenue but often have lower margins than services, which can compress overall profitability if not managed.