


If your financial reports feel “mostly right” but you don’t have confidence in them being truly reflective of your MSP’s financial reality, you’re not imagining it.
And your chart of accounts is likely the source of that insecurity. MSPs are unique businesses with recurring revenue, variable labor, pass-through costs, fluctuating licensing, and PSA-driven workflows, unlike any other business structure. But most MSPs still run their books on a generic COA meant for traditional service businesses.
So while the numbers may balance, they aren’t telling the truth.
Your margins look healthy until cash runs short. Project work looks profitable until labor finally catches up. Licensing looks stable until vendor costs spike, and you never see it in COGS.
When the structure is wrong, the story your finances tell is wrong. And that story can send you down the absolutely wrong path.
Here’s where MSP COAs go wrong and how to rebuild a COA that actually reflects how your business works.
Why the Chart of Accounts Matters for MSPs More Than Most Businesses
When you think of the financial foundations of your business, you likely think of cash flow, billing, payroll, and contracts. For most companies, that’s enough. But for an MSP with recurring revenue, pass-through vendor costs, mixed service models, and frequent changes in scope, there’s something far more fundamental that blows up everything if it’s done wrong: the chart of accounts (COA).
A COA is the structural map that defines exactly where every dollar coming in and going out lands in your books: from licensing fees to hourly labor to recurring subscriptions. And because your P&L can only report on the structure your chart of accounts gives it, a faulty COA will result in bad reporting across the board.
Of course, a weak COA increases the difficulty of bookkeeping tasks, but it also makes your financial data misleading. For example, you may believe you’re profitable…until a vendor invoice spikes licensing costs and you realize that the renewal hit months ago.
The primary takeaway? If your COA is wrong, everything built on it (like your pricing, billing, forecasting, and growth planning) is built on sand.
The Most Common COA Mistakes MSPs Make
These are the most common COA errors that keep MSPs from seeing their true financial performance.
1. Dumping All Revenue Into a Single “IT Services” Bucket
When your chart of accounts includes only a single generic revenue account for “IT Services,” every revenue stream (MRR, projects, hourly, hardware resale, licensing pass-throughs) gets funneled into the same place. That blurriness is expensive for MSPs.
Recurring revenue behaves nothing like project work. Licensing resale operates on razor-thin margins compared to labor-based services. Hardware revenue can inflate top-line numbers but tell you nothing about operational performance. According to Service Leadership’s benchmark data, best-in-class MSPs maintain 50%+ blended MRR gross margins, while project margins often fluctuate dramatically month to month, which is exactly why these categories should never sit in the same account.
And if you want a deeper walk-through of how this plays out in real MSPs, Matt Zaroff and Dean Trempelas break it down in the Common Financial Challenges for MSPs webinar, including best practices and the mechanics of true profitability.
Breaking revenue into meaningful, MSP-specific categories is the minimum requirement for understanding the financial heartbeat of your business. Because without it, you can’t evaluate whether your MRR is financially healthy on its own, whether certain types of project work consistently destroy margin, or whether licensing pass-throughs are masking vulnerabilities in labor-driven services.
2. Misclassifying Licensing and Pass-Through Costs
Licensing is one of the easiest areas for MSP data to go sideways. Most MSPs rely heavily on pass-through vendor licensing like Microsoft 365, backup tools, security stacks, and cloud consumption. But those costs are regularly inserted into operating expenses or lumped together in other broader software categories.
When licensing costs sit in overhead instead of your COGS, your margins appear healthier than they truly are. Everything looks stable until seats increase, or your vendor quietly raises prices (which happens somewhat regularly in this industry), and suddenly your “good margins” evaporate without warning.
Because MSPs resell these tools directly to clients, licensing must be treated like a COGS, not overhead. That’s the only way to accurately measure client profitability, see where tool costs are rising, and price your services to protect your bottom line.
This is one of the most common issues MSP-focused accountants and fractional CFOs correct early on, because even a small reclassification can change reported gross margin by double-digit percentages. When licensing is correctly categorized, your bottom line will actually reflect how your business operates.
3. Using Too Many Categories
On the other end of the spectrum, some MSPs take their chart of accounts to the opposite extreme: too much granularity, too many categories, and no real organizing logic. That’s why it’s important to maintain a sense of materiality with your chart of accounts.
This often happens when a COA has been inherited from a previous bookkeeper, built on a generic small-business template, or expanded one account at a time over several years without a clear structure. Before long, the report becomes a maze of 150+ accounts that look detailed but actually make financial reporting harder, not clearer.
A COA that’s too granular creates more noise than insight. Trends disappear, problem areas get lost in the weeds, and month-to-month comparisons become exhausting. It also becomes nearly impossible to reconcile PSA data with your P&L, because your operational systems won’t map to your accounting system anymore.
High-maturity MSPs will simplify their COA because they want to maintain the core details of their business. A well-designed and maintained MSP COA has a streamlined set of meaningful accounts rather than hundreds of unused ones, which is consistent with accounting best practices. This allows financial reporting to remain clear and actionable.
4. Not Breaking Out Labor Costs by Function
Labor is the single largest expense in almost every MSP, yet ironically, it’s one of the least understood. When all payroll (service desk, project labor, vCIO, admin, operations, and leadership) is piled into one expense line, there’s no way to understand the true cost of delivering services. And since managed and tech services operate conversely, your numbers will be completely confused.
You can’t see which departments are over- or under-staffed. You can’t compare PSA service metrics to real financial outcomes. And you definitely can’t price accurately when you have no visibility into how much it actually costs to deliver the work.
Breaking out labor by function transforms your financial clarity almost immediately:
Service desk labor belongs in COGS because it directly delivers your MRR.
Project labor belongs in COGS because it generates professional services revenue.
Admin and leadership payroll belong in operating expenses because they support the business rather than create revenue.
This separation also supports healthier forecasting. When labor costs rise, you can instantly see which part of the business changed and what needs to be corrected.
5. Mixing Direct and Indirect Costs
Similar to mixing revenue streams, one of the most damaging COA errors MSPs make is mixing costs related to providing service.
Direct costs (COGS) are the expenses required to deliver your services: license resale, cloud hosting, service delivery tooling, project contractors, and delivery labor.
Indirect costs are the expenses required to run the business: admin software, sales and marketing spend, rent, leadership labor, and office overhead.
When these two categories are blended, your financial statements stop reflecting the economics of your business. Cash flow trends become misleading, and your service-line profitability becomes impossible to calculate correctly. Many MSPs who mix these categories describe the same pattern: “We look profitable on paper, but cash is always tighter than expected.” If you resonate with this, the chances are good that this is the problem you’re experiencing with your chart of accounts.
Another specific driver of this problem is misclassified tooling. Most MSPs treat RMM, documentation tools, backup vendors, SOC subscriptions, cloud services, and even PSA usage as general overhead. But these aren’t admin expenses; they are the infrastructure that creates your recurring revenue. They belong in COGS.
Misclassifying tooling also hides vendor increases (industry data shows that SaaS vendors have increased prices by around 8–12% on average) and makes agreements appear better than they are. When tools are correctly classified as delivery costs (and tied to revenue streams they support), it becomes clear which services are profitable and which may need to be rethought.
What an MSP-ready Chart of Accounts Should Look Like
A well-designed MSP COA is structured enough to give you clarity and simple enough that you actually use it. At the highest level, it separates revenue in a way that reflects your service model, segments direct costs so you can measure margin accurately, and keeps indirect costs clean so you can control overhead. The best COAs map closely to your PSA structure, creating a one-to-one relationship between what your team does, what clients buy, and what your financial statements report.
For most MSPs, this means revenue categories built around MRR, projects, hourly work, hardware, and licensing resale; COGS categories tied to direct labor, vendor tools, licensing, cloud usage, and contractors; and a streamlined but thoughtful set of operating expense categories for everything else. When these elements are structured correctly, your P&L stops being a retrospective report that shows exactly where your money goes, where your margins are shifting, and where to focus your efforts next.
Below are the core categories that nearly every MSP should include, organized to support both accounting best practices and the way MSPs actually deliver work. This is compiled from one of the most trusted COA templates out there, the Service Leadership Index:
TL;DR:
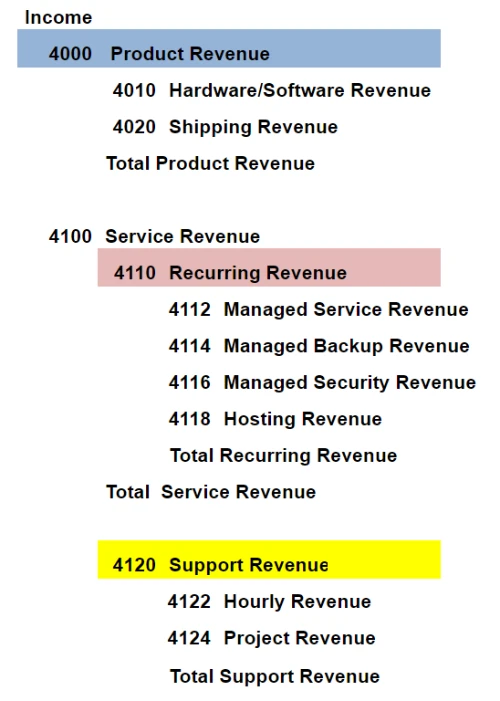
Revenue Categories (Reflect How You Sell Services)
Revenue should be segmented so you can see profitability by type, not just in total.
- Managed Recurring Revenue (MRR) – captures support, monitoring, and ongoing managed agreements.
- Project & Professional Services Revenue – fixed-fee or defined-scope milestone work.
- Hourly / Time & Materials Revenue – break/fix, consulting, or ad-hoc work.
- Hardware Resale Revenue – equipment margins separated from service.
- Software & Licensing Resale Revenue – pass-through revenue tied to vendor licensing.
COGS (Track the True Cost of Delivery)
Direct costs are those you incur only when you deliver service. Proper classification here is essential for accurate gross margin.
- Direct Labor — Service Delivery – support desk, help desk, NOC, first-line resources.
- Direct Labor — Project Delivery – project engineers, implementation teams.
Direct Labor — Specialty Roles – vCIO, vCISO, SOC analysts when delivering billable services. - Third-Party Contractors/Subcontractors – when you outsource work tied to a client engagement.
- Vendor Tools & Licensing (COGS) – RMM, backup, security, cloud subscriptions tied to client usage.
- Cloud Resale / Consumption Costs – Azure, AWS, Google Cloud, where client revenue is tied to usage.
Operating Expenses (Keep Overhead Understandable)
Operating expenses are the costs of running the business, not tied to specific client delivery.
- Administrative Salaries & Overhead – HR, operations, and finance team salaries.
- Sales & Marketing – demand generation, sales commissions, branding.
- Leadership Salaries – executive and management payroll not tied to delivery.
- Office & Facilities – rent, utilities, general office expenses.
- General Software – internal tools (HR systems, internal collaboration tools, etc.) not directly used in service delivery.
- Professional Services & Fees – legal, accounting, audit fees.
Other Income & Expense Categories (Optional but Helpful)
- Interest Income / Expense – separate lines for financing costs or investment income.
- Depreciation / Amortization – for capital assets used over time.
How to Fix Your MSP Chart of Accounts
Rebuilding an MSP COA doesn’t require reinventing your accounting system. But it does require aligning your books with the way your business actually runs. The first step is mapping your PSA to your accounting structure if you haven’t already, so service items, billing rules, and labor roles flow cleanly into your financial categories. If the PSA is your operational source of truth, your accounting system must be the financial representation of that same truth. Otherwise, you end up with two competing realities that never reconcile.
From there, rebuild revenue and COGS before touching overhead. Most MSPs do this backward, but if your margins aren’t accurate, nothing else will be either. Revenue classes should mirror your service delivery model, while COGS should capture every cost directly tied to delivering those services. Not just a vague “labor” category. Once the major buckets are accurate, break out labor based on function and reclassify tooling so it lands where it belongs: in the cost of delivering your services, not buried in overhead where it hides its impact on profitability.
At this point, the final step is simplification. Most of the chaos in MSP financials comes from redundant, overlapping, or outdated accounts that no longer reflect how the business operates. Revisit your COA and clean up incorrect or duplicated data.
When your COA reflects how your business truly works, your reporting becomes easier to interpret, your forecasting becomes more reliable, and your strategic decisions become grounded in real data instead of approximations.
If you feel unsure or exhausted by your MSP’s finances and don’t know where to start, watch our webinar the Common Financial Challenges for MSPs and How to Avoid Them.
FAQs
Why do MSPs need a different chart of accounts than traditional service businesses?
Because MSPs rely on recurring revenue, variable labor, licensing pass-throughs, and PSA workflows that generic small-business COAs simply aren’t structured to support.
Do I need a separate revenue account for every client or service?
You only need revenue categories by service type (MRR, projects, hourly, licensing), not by individual customer or contract.
What’s the biggest COA mistake MSPs make?
Failing to categorize COGS correctly.
How detailed should my labor accounts be?
Detailed enough to separate labor by function (service desk, project, vCIO, etc.) but not so granular that the chart becomes unmanageable.
Should tooling and software live in overhead or COGS?
Any tool required to deliver contracted services belongs in COGS, not overhead.
Can a bad COA really impact pricing and profitability?
If revenue and costs aren’t mapped correctly, every pricing, forecasting, and margin decision you make will be based on distorted data. So yes.


%20(1).jpg)